I found my RIU confirmation mail in my spam folder
 @tomate
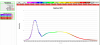
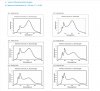
 - who is or was a RIU user as well- wrote on grower.ch about a modified Relative Quantum Efficiency graph and posted the modified Excel file:
Translation:
"I am attaching here a slightly extended excel table from alesh.
This table was extended by the cannabis adapted RelativeQuantumEfficiency curve from the beta test team of the icmag forum to get a YPF instead of PPF value. In addition there is now the usual PPF QER value for the standard 400-700nm range and a range of 380-780nm often used by HLG and Co. with which they can improve their values a bit.
By the weighting according to the RQE and the resulting QER for the YieldPhotonFlux comparisons of different spectra should be more meaningful."
(Translated with DeepL)
I can't post the link yet

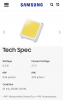
These are the values for the 6500K LM301H:
LER [lm/W] = 318,38741
QER 400-700 [µmol/J] = 4,44308
QER 380-780 [µmol/J] = 4,514679
QER 360-760 YPFc [µmol/J] = 3,74334
At 38lm per diode and estimated 175,5mw it's about 3,07µmol/J using the 380-780nm QER.
1% error
Maybe that could also be a coincidence.. I don't know
 85.1 KB Views: 29