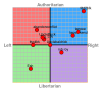
We've talked about it. But our conversation ended rather than concluded. I did go to the website and read their "explanation". It just discussed the method but not validity. Graphs like this are pretty much meaningless but look meaningful because we are used to seeing real information mapped out using real data points and real units of measure. Not saying it's fake, just not as meaningful as you seem to think it is.
I don't understand the units. Is it oranges up and down and apples left and right? The scale is subjective and not linear, meaning the distance between the hash marks don't represent a uniform increase in whatever the units are. The graph coveys a false sense of uniform differences. It is more of a distortion of reality than an representation of it.

.png")