Download scientific diagram | Evolution of the THCA, CBDA, and CBGA content in leaves and fl owers during the growth of plants from chemotypes I, II, and III. These values are the averages of all studied plants in each chemotype, with each one measured in triplicate. R.G. refers to the...

www.researchgate.net
Well we know that the natural degradation process is THCA> THC > CBN, and this process of decarboxylation begins as soon as the trichome is exposed to oxygen. Therefore we can infer that the decarboxylation of CBDA also begins as soon as the trichome is exposed to oxygen , meaning it will begin to decarboxylate on the living plant as soon as it appears.
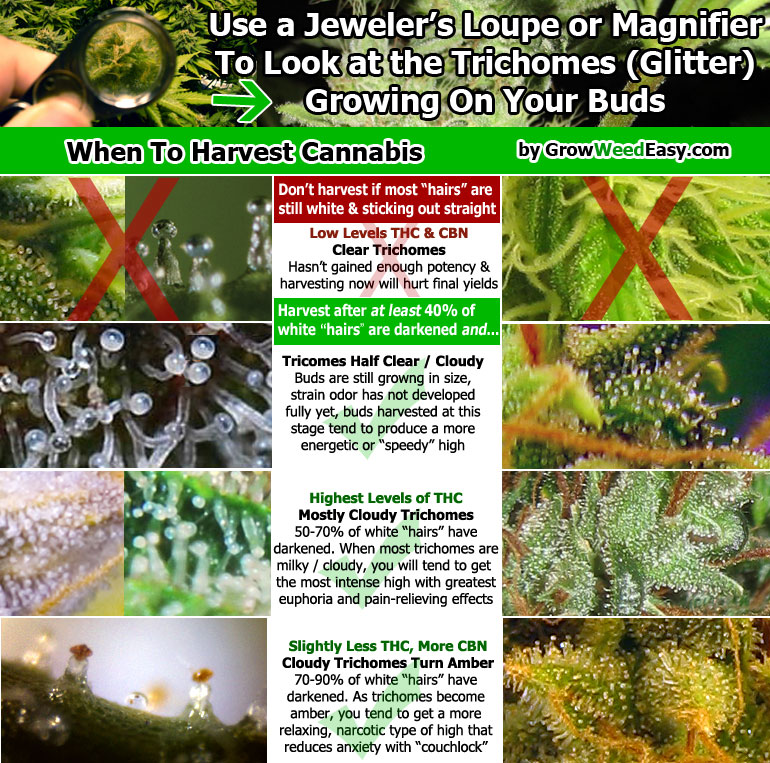
We also know that when a trichome is clear , it has high THCA content. When a trichome is cloudy is has high levels of THC. And when trichomes are amber, they are high in CBN.
From what I gather, this study doesn’t take into account the natural process of decarboxylation when exposed to oxygen. It only takes into account the transition from CBGA > CBDA and the presence of CBD and not the degradation further into CBN. That’s why it seems like the CBDA / THCA peak at week 7 and continue to be stable til the end of the flowering phase. I’m not a scientist by any means and please tell me if I’m wrong, but thats the only way I can make sense of this graph. It is enough though to see that the THCA and CBDA rise and fall coincidentally.
My conclusion is that since CBDA and THCA mature at the same rate within both cannabis plants and cannabis flowers , we can gauge the maturity of the CBDA the same way that we gauge the maturity of THCA , by checking the trichomes.
Please do not take this as fact, just my personal oppinion based off some quick research. Any and all input is greatly appreciated.


