I have completed phase II of my study.
Over the last week, I came across a recent paper that suggested the HADCRUT4 data may have potential errors in it.
I'll spare the details, but this
forced me to consider using the GISS data instead for the monthly analysis.
I've spent the better part of the last 6 hours figuring out a shitload of new techniques and functions in IGOR, so I could present this colourful picture of
evidence for the purposes of debate.
Hooray for you all.

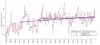
The
black line is the first instance where I could say the slope was flat. Yes, it still had a b-value of 0.005 or so, but at that scale, a butterfly's fart could change the temperature. The
purple line is the 17 year regression, with the coefficient values (don't forget the scale modifier on the left axis).
Now if "deniers" want to call that flat, I could accept that withing error bounds. But is it anything to get excited over?
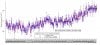
Would you look at that? I MEAN WOULD YOU JUST LOOK AT THAT?!?!?!
Look at that slope for the 307 month period. That's as flat as the temperature change gets when the butterfly HOLDS its fart in!
In conclusion, there is an argument for those that say the rate of change has stalled, but it's still not conclusive evidence the trend has reversed when compared with precedent.
Therefore, I need more funding for 10 years to collect more data.
Give it to me now. Someone, let me borrow your Obamaphone so I can call up the president and get this settled!
$1.5Mn will be enough, thanks.
But if you call in the next 20 minutes--because you know we can't do this all day--you can get my research for only $150k !
That's a savings of a gajillion percent!!!
But wait, order now and you'll get a FREE LED!
Genuine 3W of quality Chinese craftsmanship.
Handjobs and Bitcoin not accepted.